In 2026, the average enterprise observability bill is no longer just a line item; it is a board-level crisis. As engineering teams navigate highly distributed microservice architectures, serverless runtimes, and high-cardinality Kubernetes environments, the cost of monitoring has frequently outpaced the cost of running the actual infrastructure. This financial pressure has brought the industry to a critical crossroads: opentelemetry vs datadog. Organizations are forced to choose between the seamless, out-of-the-box magic of a proprietary SaaS giant and the open-source, vendor-agnostic flexibility of the Cloud Native Computing Foundation (CNCF) standard.
For platform engineers and Site Reliability Engineers (SREs), this decision is rarely a simple binary choice. It is a complex architectural trade-off. Do you buy your way out of operational overhead with Datadog, or do you build a future-proof telemetry pipeline with OpenTelemetry? This comprehensive guide breaks down the technical, operational, and financial realities of both approaches to help you architect an observability strategy that keeps your systems reliable and your budgets predictable.
The Core Philosophy: Vendor Lock-In vs. Telemetry Democratization
To understand the practical differences between these two solutions, we must first examine their underlying philosophies. Datadog was born in 2010 as a proprietary SaaS monitoring tool designed to break down the silos between systems administrators and developers. It succeeded by providing a unified interface where metrics, logs, and traces are automatically linked together. However, this convenience comes with a catch: proprietary lock-in. When you instrument your applications using Datadog\'s custom SDKs and agents, your telemetry data is formatted specifically for Datadog\'s backend. If you ever decide to switch vendors, you face a massive, high-risk refactoring project.
In contrast, OpenTelemetry (OTel) is an open-source observability framework formed by the merger of OpenTracing and OpenCensus under the CNCF. OTel does not provide a storage backend, query language, or visualization dashboard. Instead, it provides a standardized set of APIs, SDKs, and tooling to collect, process, and export telemetry data (Metrics, Logs, and Traces—commonly referred to as the MELT framework).
"Adopt OpenTelemetry no matter which observability solution you pick. It makes changing third-party tools a non-event. The methods and implementations remain the same—just the endpoint and config change for the new tool." — Platform Engineer, r/kubernetes
By decoupling the instrumentation layer from the storage and analysis layer, OpenTelemetry democratizes your telemetry. It gives you complete ownership of your data, allowing you to route the same stream of metrics or traces to multiple backends simultaneously. In 2026, this vendor-agnostic architecture has become the gold standard for future-proofing cloud-native applications.
Architectural Deep-Dive: OpenTelemetry Collector vs Datadog Agent
At the heart of both ecosystems lies a local processing daemon responsible for collecting system metrics, receiving application traces, and forwarding data to its final destination. Comparing the opentelemetry collector vs datadog agent highlights two fundamentally different approaches to telemetry ingestion.
The Datadog Agent
The Datadog Agent is a single, monolithic binary running on your hosts or as a DaemonSet in your Kubernetes clusters. It is highly optimized, closed-source under the hood (though with open-source wrappers), and features extensive auto-discovery capabilities.
When deployed, the Datadog Agent automatically scans the host for running processes, identifies technologies (such as Redis, PostgreSQL, or Nginx), and immediately begins scraping metrics using pre-configured integrations. This "magic" makes it incredibly easy for small, fast-moving teams to establish comprehensive monitoring in minutes.
The OpenTelemetry Collector
The OpenTelemetry Collector is a highly modular, pluggable proxy designed to receive, process, and export telemetry data. It consists of three core pipeline stages:
- Receivers: Define how data enters the collector. This can be via native OTLP (OpenTelemetry Protocol), Prometheus, Jaeger, Zipkin, or host metrics receivers.
- Processors: Perform data transformation, batching, memory limiting, attribute filtering, and—crucially—tail-sampling.
- Exporters: Define where the processed data is sent. This can be to an open-source backend like ClickHouse, a SaaS platform like Grafana Cloud, or even to Datadog itself.
+-------------------------------------------------------------+ | OpenTelemetry Collector | | | | +------------+ +---------------+ +------------+ | | | Receivers | ---> | Processors | ---> | Exporters | | | | (OTLP, | | (Batch, Tail- | | (OTLP, | | | | Prometheus)| | Sampling) | | Datadog) | | | +------------+ +---------------+ +------------+ | +-------------------------------------------------------------+
This modular pipeline architecture gives platform engineers unprecedented control over their data before it leaves their network boundaries. Below is a comparison table of their technical capabilities:
| Capability | Datadog Agent | OpenTelemetry Collector |
|---|---|---|
| License | Proprietary / Closed Backend | Apache 2.0 (100% Open Source) |
| Auto-Discovery | Out-of-the-box auto-configuration | Requires manual configuration / helper operators |
| Extensibility | Limited to Datadog integrations | Pluggable architecture (custom receivers/exporters) |
| Edge Processing | Basic filtering and obfuscation | Advanced processors, tail-sampling, metadata enrichment |
| Vendor Lock-In | High | Zero |
| Memory Footprint | Moderate to High | Low to Moderate (highly tunable) |
Sample OpenTelemetry Collector Configuration
To demonstrate the power of the OTel Collector pipeline, here is a production-ready otel-collector-config.yaml that accepts OTLP data, filters out sensitive PII, and exports it to both an open-source ClickHouse cluster and Datadog:
yaml receivers: otlp: protocols: grpc: endpoint: 0.0.0.0:4317 http: endpoint: 0.0.0.0:4318
processors: batch: send_batch_size: 8192 timeout: 5s send_batch_max_size: 10240
memory_limiter: check_interval: 1s limit_percentage: 75 spike_limit_percentage: 15
# Redact sensitive headers and PII before exporting redaction: allowed_headers: - "Accept" - "User-Agent" blocked_values: - "(?i)password" - "(?i)api_key"
exporters: otlp/clickhouse: endpoint: "clickhouse-otel.monitoring.svc.cluster.local:4317" tls: insecure: true
datadog: api: key: "${env:DD_API_KEY}" site: "datadoghq.com"
service: pipelines: metrics: receivers: [otlp] processors: [memory_limiter, batch] exporters: [datadog, otlp/clickhouse] traces: receivers: [otlp] processors: [memory_limiter, redaction, batch] exporters: [datadog, otlp/clickhouse]
APM and Distributed Tracing: OpenTelemetry Tracing vs Datadog APM
When evaluating opentelemetry tracing vs datadog apm, we are looking at two distinct ways of understanding application behavior. Application Performance Monitoring (APM) is where Datadog earned its industry reputation, but OpenTelemetry has closed the gap significantly in recent years.
Datadog APM: The Seamless Experience
Datadog\'s APM is incredibly polished. By leveraging runtime-specific agents (such as their Java, Go, or Python tracing libraries), Datadog automatically injects itself into common web frameworks, database drivers, and HTTP clients.
Its primary strength lies in its correlation UI. Within a single dashboard, a developer can click on a slow trace span and instantly view: - The exact log lines generated during that specific trace. - The CPU and memory metrics of the container hosting that execution at that millisecond. - Outlier detection highlighting if a database slow-down is localized to a single host or replica.
This seamless navigation is what engineers refer to as the "single pane of glass." It dramatically reduces Mean Time to Resolution (MTTR) during complex production incidents.
OpenTelemetry Tracing: Standardized and Scalable
OpenTelemetry tracing relies on a standardized semantic convention. It defines exactly how traces, spans, and attributes should be formatted across all programming languages.
Historically, the biggest complaint about OTel tracing was the lack of auto-instrumentation. In 2026, this is no longer the case. The CNCF now provides robust auto-instrumentation agents for Java, .NET, Node.js, and Python, allowing you to capture database queries, HTTP payloads, and gRPC calls without changing a single line of code.
The Sampling Advantage
One area where OpenTelemetry clearly outperforms Datadog is advanced sampling. Datadog bills you for every span ingested and indexed. To keep costs down, you are often forced to use head-sampling (making a decision to keep or drop a trace at the start of the request).
With OpenTelemetry, you can leverage tail-sampling inside the OTel Collector. Because the collector buffers spans locally, it can inspect the entire trace before deciding to keep it. This allows you to construct rules like:
- Drop 99% of successful HTTP 200 requests to /healthz endpoints.
- Keep 100% of traces that result in an HTTP 5xx error.
- Keep 100% of traces where the latency exceeds 500ms.
- For critical financial transaction paths, maintain 100% sampling to meet audit and compliance requirements.
This intelligent filtering dramatically reduces your backend storage costs while ensuring you never lose the critical, high-value trace data needed to debug rare production anomalies.
The Financial Reality: OpenTelemetry vs Datadog Cost Breakdown
No discussion of opentelemetry vs datadog cost is complete without addressing the notorious complexity of proprietary SaaS billing. Datadog\'s pricing is multi-dimensional and highly granular. You are billed not just for the hosts you monitor, but also for: - Custom metrics (billed per metric name/tag combination, which can explode with high-cardinality data like user IDs or container hashes). - Indexed log volume (billed per GB ingested and per million events retained). - APM hosts, profiled containers, and database monitoring add-ons. - Network data processed and synthetic test runs.
This pricing model often creates a "collaboration tax." SREs are forced to restrict developer access to dashboards, aggressively drop custom metrics, and limit log retention simply to avoid astronomical, unpredictable bills.
"Datadog pricing pissed off management... Once you\'re deep in Datadog, the switching cost feels massive even when the bill hurts. You become way too dependent on them." — SRE, r/sre
OpenTelemetry completely flips this financial dynamic. Because OTel is open-source and free, your only costs are the compute and storage resources required to run your telemetry pipeline.
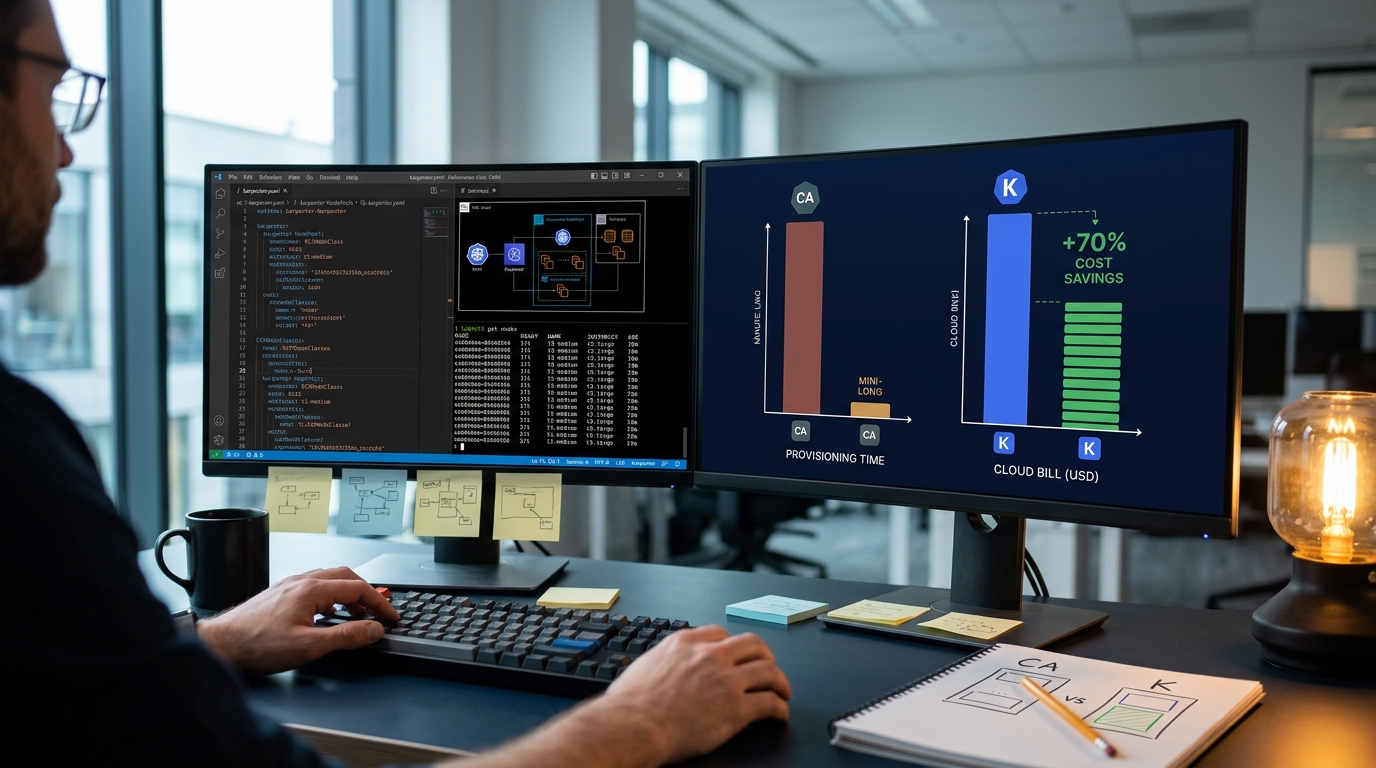
By leveraging highly efficient, self-hosted datastores, organizations can achieve massive cost savings. For example, engineers running on-premise compute and block storage have successfully built observability pipelines that completely wreck the cost comparisons of Datadog and Dynatrace.
Let\'s look at a realistic financial comparison for a mid-sized engineering organization running 150 microservices across 300 Kubernetes nodes, ingesting 100 GB of logs per day, and tracking 5,000 custom metric series:
| Cost Category | Datadog SaaS (Estimated Monthly) | OpenTelemetry + ClickHouse/SigNoz (Monthly) |
|---|---|---|
| Infrastructure Monitoring | $4,500 ($15 per host/month) | $0 (Included in cluster compute) |
| APM & Tracing | $9,300 ($31 per host/month + span indexing) | $0 (Included in cluster compute) |
| Log Ingestion & Indexing | $3,000 ($0.10/GB + retention fees) | $0 (Storage only) |
| Custom Metrics | $2,500 ($0.05 per metric series over limit) | $0 (High-cardinality is free in ClickHouse) |
| Platform Compute / Storage | $0 (SaaS managed) | $1,800 (AWS EKS, GP3 volumes, S3 archives) |
| Maintenance Overhead | $0 (No maintenance) | $2,500 (Allocated SRE engineering time) |
| Total Estimated Monthly Cost | $19,300 | $4,300 |
| Annual Cost | $231,600 | $51,600 (77% Savings) |
The Best OpenTelemetry Backends in 2026
Because OpenTelemetry does not store or visualize your data, you must pair it with a backend capable of handling high-volume telemetry. If you are moving away from Datadog, here are the best opentelemetry backends 2026 has to offer, categorized by deployment type:
1. SigNoz (Open-Source Datadog Alternative)
SigNoz is specifically designed to be the open-source answer to Datadog. Built natively on OpenTelemetry and powered by ClickHouse, SigNoz provides a single, unified dashboard for metrics, traces, and logs. It eliminates the "context-switching nightmare" by automatically correlating signals out of the box.
- Pros: Native OTel support, unified UI, no user-based pricing, highly efficient ClickHouse backend.
- Cons: Requires self-hosting and scaling (though a managed cloud version is available).
2. The Grafana "LGTM" Stack (Loki, Grafana, Tempo, Mimir)
Grafana Labs has built a powerhouse open-source ecosystem. This stack consists of Loki for logs, Tempo for tracing, Mimir for metrics, and Grafana for visualization. It is highly modular and scales horizontally to handle petabytes of data.
- Pros: Best-in-class dashboard visualization, massive community support, extremely cost-effective object storage (S3) integration.
- Cons: Not a single unified platform. You are essentially stitching together four distinct tools, which can lead to configuration complexity and dashboard sprawl.
3. ClickHouse & VictoriaMetrics (The SRE Power Combo)
For teams with high-cardinality data who want to run a lean, high-performance self-hosted setup, combining VictoriaMetrics (for metrics) and ClickHouse (for logs and traces via tools like VictoriaLogs or custom schemas) is incredibly powerful.
- Pros: Unmatched performance. ClickHouse can perform complex search queries across terabytes of logs in seconds while using up to 10x less memory than Elasticsearch.
- Cons: High engineering learning curve; requires dedicated database administration expertise.
4. SaaS Backends (Honeycomb, New Relic, Dash0)
If you want the vendor-agnostic benefits of OpenTelemetry but do not want to manage databases, you can send your OTel data directly to modern SaaS platforms. Honeycomb is world-class for debugging distributed traces and high-cardinality events, while Dash0 has emerged as a promising, OTel-native observability platform built for predictable billing.
Step-by-Step Guide: How to Migrate from Datadog to OpenTelemetry
Making the decision to migrate from datadog to opentelemetry can feel daunting. However, by leveraging a phased, "dual-shipping" approach, you can transition your entire telemetry pipeline with zero downtime and minimal risk.
Phase 1: Deploy the OpenTelemetry Collector
Before touching your application code, deploy the OpenTelemetry Collector into your environment. Configure the collector to accept OTLP data and export it directly to Datadog using the native datadog exporter. This establishes your data pipeline without changing how your current alerts or dashboards function.
Phase 2: Implement OpenTelemetry SDKs (Dual-Shipping)
Update your application code to use OpenTelemetry APIs and SDKs. Instead of sending data directly to Datadog, point your OTel SDKs to your local OTel Collector.
Inside the collector, configure a dual-shipping pipeline. This routes your telemetry to both Datadog (to keep your existing monitors active) and your new target backend (such as SigNoz or Grafana Cloud) for validation.
Here is a code example demonstrating how to initialize an OpenTelemetry tracer provider in a Go application, configuring it to export to your OTel Collector:
go package main
import ( "context" "log" "time"
"go.opentelemetry.io/otel"
"go.opentelemetry.io/otel/exporters/otlp/otlptrace/otlptracegrpc"
"go.opentelemetry.io/otel/sdk/resource"
sdktrace "go.opentelemetry.io/otel/sdk/trace"
semconv "go.opentelemetry.io/otel/semconv/v1.24.0"
"google.golang.org/grpc"
"google.golang.org/grpc/credentials/insecure"
)
func initTracer(ctx context.Context) (*sdktrace.TracerProvider, error) { // Connect to the local OpenTelemetry Collector via gRPC conn, err := grpc.DialContext(ctx, "otel-collector.monitoring.svc.cluster.local:4317", grpc.WithTransportCredentials(insecure.NewCredentials()), grpc.WithBlock(), ) if err != nil { return nil, err }
// Set up the OTLP trace exporter
exporter, err := otlptracegrpc.New(ctx, otlptracegrpc.WithGRPCConn(conn))
if err != nil {
    return nil, err
}

// Define resource attributes to identify this service
res, err := resource.New(ctx,
    resource.WithAttributes(
        semconv.ServiceNameKey.String("payment-processor"),
        semconv.ServiceVersionKey.String("v2.1.0"),
        semconv.DeploymentEnvironmentKey.String("production"),
    ),
)
if err != nil {
    return nil, err
}

// Create the TracerProvider with batch processing and a tail-sampling friendly sampler
tp := sdktrace.NewTracerProvider(
    sdktrace.WithSampler(sdktrace.AlwaysSample()), // Let the Collector handle sampling decisions
    sdktrace.WithBatcher(exporter, sdktrace.WithBatchTimeout(5*time.Second)),
    sdktrace.WithResource(res),
)

otel.SetTracerProvider(tp)
return tp, nil
}
func main() { ctx := context.Background() tp, err := initTracer(ctx) if err != nil { log.Fatalf("Failed to initialize tracer: %v", err) } defer func() { if err := tp.Shutdown(ctx); err != nil { log.Printf("Error shutting down tracer provider: %v", err) } }()
log.Println("OpenTelemetry tracing initialized successfully!")
// Application logic continues here...
}
Phase 3: Recreate Dashboards and Alerts
Once you confirm that telemetry is flowing accurately to both backends, begin rebuilding your critical dashboards and alerts in your new platform. Focus on Service Level Objectives (SLOs) rather than generic infrastructure metrics. This is an ideal time to clean up legacy "alert noise" and eliminate dashboards that are no longer used.
Phase 4: Deprecate the Datadog Agent
With your alerts and dashboards validated in the new OTel backend, update your collector configuration to remove the Datadog exporter. Finally, uninstall the Datadog Agent from your servers and Kubernetes clusters. Your migration is complete, and you are now running on a 100% vendor-agnostic telemetry pipeline.
Real-World Engineering War Stories: "Tab-Juggling and Vibes"
To understand why this choice matters, we must look beyond marketing slides and examine the reality of incident response. In many organizations, observability is not a unified strategy; it is a chaotic collection of disjointed tools.
"The tab-switching at 2 AM is the actual MTTR killer that never shows up in postmortems. Everyone blames the alert; nobody blames the 20 minutes spent figuring out if the Sentry spike and the Datadog alert are even related. It is just tab-juggling and vibes." — SRE, r/sre
Consider this common scenario: A database CPU spike triggers a Datadog alert. Simultaneously, an error rate spike triggers a Sentry alert. Meanwhile, developers are digging through logs in an AWS CloudWatch console. Three different engineers are looking at three different screens, narrating their findings over Slack. The "context switching overhead" quietly doubles your outage duration.
This is where Datadog excels. Its interface is designed to keep you inside a single workflow. However, OpenTelemetry-native platforms like SigNoz are rapidly matching this capability. By ensuring that your logs, metrics, and traces all share the exact same trace and span IDs by default, OpenTelemetry allows you to jump from a metric spike to the exact line of code that caused it in a single click.
Furthermore, platform engineers often face political battles when trying to build sustainable observability stacks. Upper management, frequently influenced by enterprise sales pitches, may ask if an internal monitoring solution has "AI capabilities."
An SRE leader at a major fintech firm shared their pragmatic response to this distraction:
"Squirrel, please. Today, you get six teams on a Zoom call to play \'where\'s my payment\' and you are worried about AI? Let\'s focus on baby steps. First, let\'s get 100% trace correlation so we can actually see where the transaction failed."
By focusing on the fundamentals of structured telemetry and robust trace propagation, engineering teams can solve real-world debugging challenges far faster than any generic AI assistant.
Key Takeaways
- Decouple Instrumentation: Always use OpenTelemetry for your application instrumentation. It completely eliminates vendor lock-in, allowing you to switch storage and visualization backends with zero code changes.
- Control Your Costs: Leverage the OpenTelemetry Collector to perform tail-sampling at your network edge. Drop low-value health check data and keep 100% of errors and latency outliers to drastically reduce storage bills.
- SaaS vs. Self-Hosted: Datadog is an exceptional, feature-rich platform, but it is highly expensive. If you have the platform engineering resources to manage an open-source ClickHouse or SigNoz stack, you can save up to 80% on observability costs.
- Avoid Tool Proliferation: Running multiple disjointed tools (e.g., Prometheus for metrics, Sentry for errors, ELK for logs) kills developer productivity. Consolidate your data under a single unified backend.
- Migrate Safely: Use a dual-shipping migration strategy. Route your OTel data through the Collector to both Datadog and your new target backend to validate your monitoring setup before cutting the cord.
Frequently Asked Questions
Is OpenTelemetry a replacement for Datadog?
No. OpenTelemetry is not a complete replacement because it does not provide a storage backend, query engine, or user interface. OTel replaces the Datadog Agent and SDKs for data collection. To fully replace Datadog, you must pair OpenTelemetry with a backend platform like SigNoz, Grafana Cloud, Honeycomb, or Elasticsearch.
Can I use OpenTelemetry with Datadog?
Yes, and this is highly recommended. You can instrument your applications using OpenTelemetry APIs and configure your OpenTelemetry Collector to export data directly to Datadog. This gives you the flexibility to use Datadog\'s polished UI today while keeping your application code 100% vendor-agnostic for the future.
Why is Datadog so expensive compared to OpenTelemetry?
Datadog bills you using a complex, multi-dimensional pricing model that charges for hosts, containers, custom metrics, and indexed logs. High-cardinality data (such as user IDs or dynamic container tags) can quickly cause your bill to balloon. With OpenTelemetry, you only pay for the raw compute and storage (like S3 or block storage) required to run your chosen backend.
What are the best open-source backends for OpenTelemetry in 2026?
In 2026, the leading open-source backends are SigNoz (which provides a unified Datadog-like experience), the Grafana LGTM stack (Loki, Grafana, Tempo, Mimir), and ClickHouse (for teams who want a highly efficient, customizable, and high-performance datastore for logs and traces).
Does OpenTelemetry support auto-instrumentation?
Yes. OpenTelemetry provides highly mature auto-instrumentation agents for popular runtimes including Java, .NET, Node.js, Python, and Go. These agents automatically capture database queries, HTTP requests, gRPC calls, and system metrics without requiring manual code changes.
Conclusion
The choice between opentelemetry vs datadog is not a simple question of which tool is better. It is a strategic business decision. If you are a fast-growing startup with limited platform engineering resources, paying the premium for Datadog can save you valuable engineering time, allowing your team to focus entirely on building your core product.
However, if you are a scaling enterprise or a cost-sensitive organization running high-volume, high-cardinality workloads, continuing to pay Datadog\'s premium pricing can quickly become unsustainable. By investing in an OpenTelemetry-native pipeline and pairing it with a high-performance backend like ClickHouse or SigNoz, you can build an incredibly robust, future-proof observability platform that keeps your systems reliable, your developers productive, and your cloud budget completely under control.
Looking to optimize your developer productivity and streamline your software architecture? Explore our highly rated developer tools on CodeBrewTools to automate your workflows today.